Face Aging MN
Exploring the Impact of
Minnesota’s Aging Population
01:
Dream Big -
Data
Overload
If no political and financial action is taken, the state of Minnesota is facing a population aging crisis.
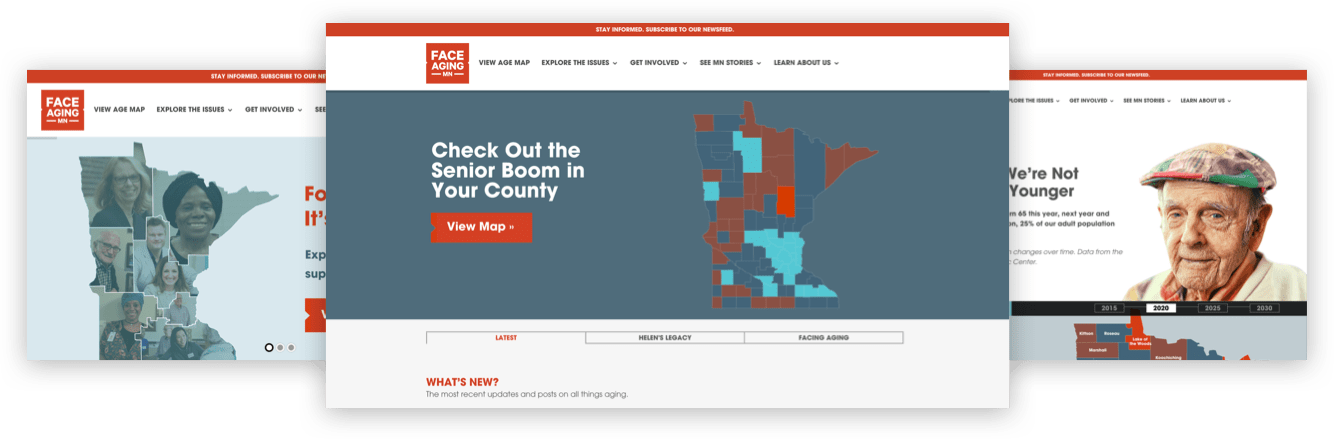
Face Aging MN was aiming to put a spotlight on the issue. They reached out to our team for fresh eyes and some strategic advice. We discussed the website’s role in reaching their key goals, and came up with a list of fresh ideas to maximize impact.
Together, the biggest need identified was to make the website feel more dynamic and engaging. The website shared good information and some stories, but lacked personal impact. One of the assets we uncovered was statewide aging data.
02:
plan smart -
Meaningful
Data
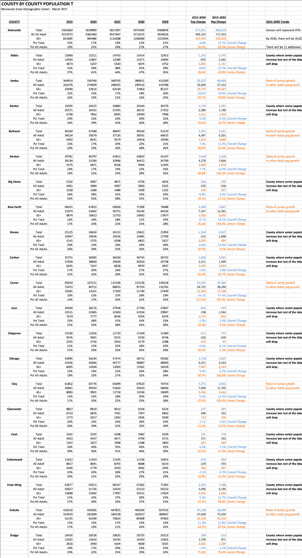
Armed with a load of data, we knew we couldn’t lose sight of the real human element. Bite-size graphical stats would not convey data in a meaningful way. We had to make it come to life at both the state and county level.
After further consideration, our team proposed an exciting new idea. What if we used Minnesota aging data to make an interactive map, showing the story unfold visually and letting the user explore for themselves. The client liked the idea, so we determined the full budget and started designing a prototype.
03:
Plan Smart -
Making Data
Interactive
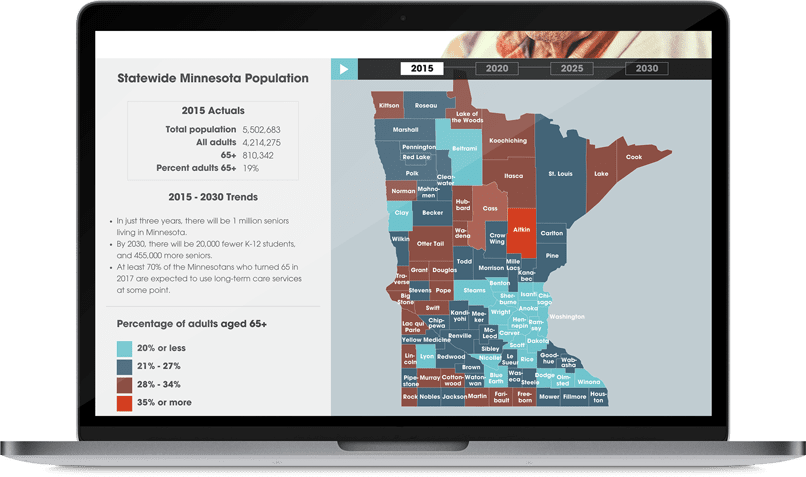
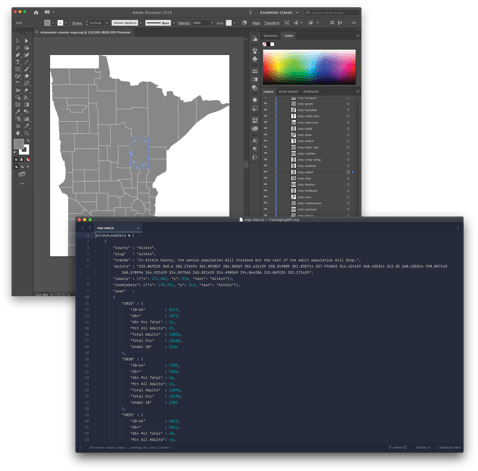
The prototype would need to take into account several key aspects of the data: counties, age brackets, trend summaries, and a timeline. It was also important to reflect the Face Aging brand, so we developed a cohesive and on-brand color spectrum.
04:
Do Well -
Building
The Map
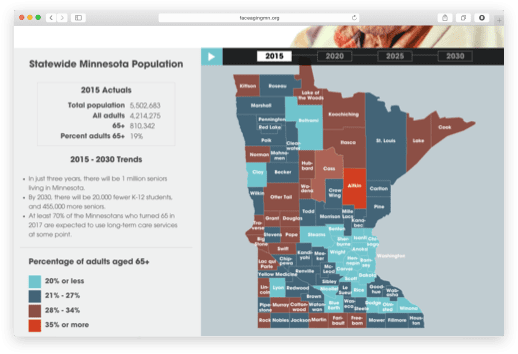
We explored different mapping technologies such as Google Maps and Mapbox, but decided instead to create a scaleable vector graphic (SVG), that we could directly manipulate and control with data. With this approach, we could better control the experience and easily zoom in on any particular county to reveal more details. Using Vue.js, we then combined the shape data, population data, and design elements.
05:
Do Well -
Animation &
Interactivity
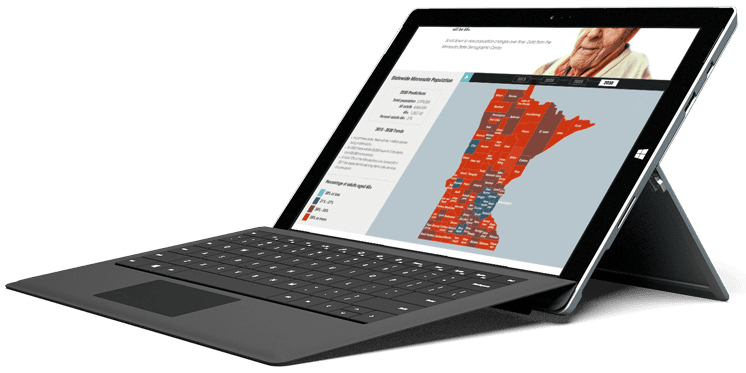
To truly see the impact of population aging, you need to see how the data changes over time. Once the map’s technical foundation was laid, it was time to bring the data to life.
06:
Do Well -
Mobile
Optimized
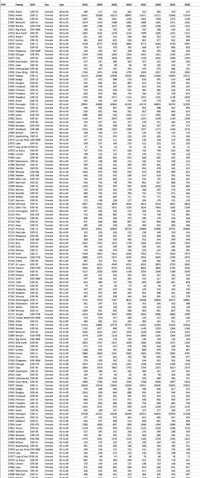
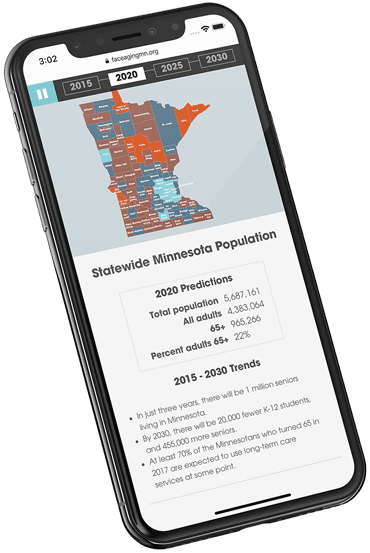
Mobile optimization matters, but especially in this case because mobile Facebook ads were a key part of the awareness strategy. We took on the challenging task of making the data map work well on small screens too.
07: Impact - Results
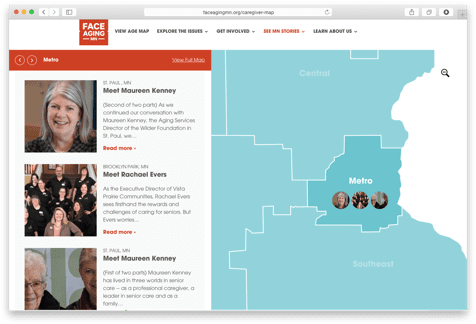
The client loved the interactive map, and it became the most visited page of the website, with nearly 4 minutes of engagement per visitor. The client team said it was “the best thing Face Aging has done to date.” It was exciting to see their campaign grow and gain interest across the state. This success led us to create a similar map which visually showcased caregiver stories from their blog. We used similar SVG technology for the map, but dynamically pulled in stories and thumbnails from the blog back-end. Users could then explore stories about the impact of caregivers in their region.
08:
Impact -
Thoughts
from the Team
We love the interactive features BrandHood came up with. Their team was able to design and execute these features, while unifying the interests of 2 different audiences seamlessly.
They’re very creative and good at what they do. There are no barriers in communication with their team. They have a great culture and staff that are both approachable and easy to work with. We just renewed our contract.
Face Aging MN Team
Identifying opportunities, and then coming up with an interactive data map was a really fun challenge. We had to create something that is engaging, on-brand, and technically difficult to build. We are pleased with how it turned out, and even more excited about how much positive impact it's had for our client.
Brandhoot Team